[Bitop Review] Crypto Analysis: BTC, ETH, LTC
2025年06月17日发布
BTC

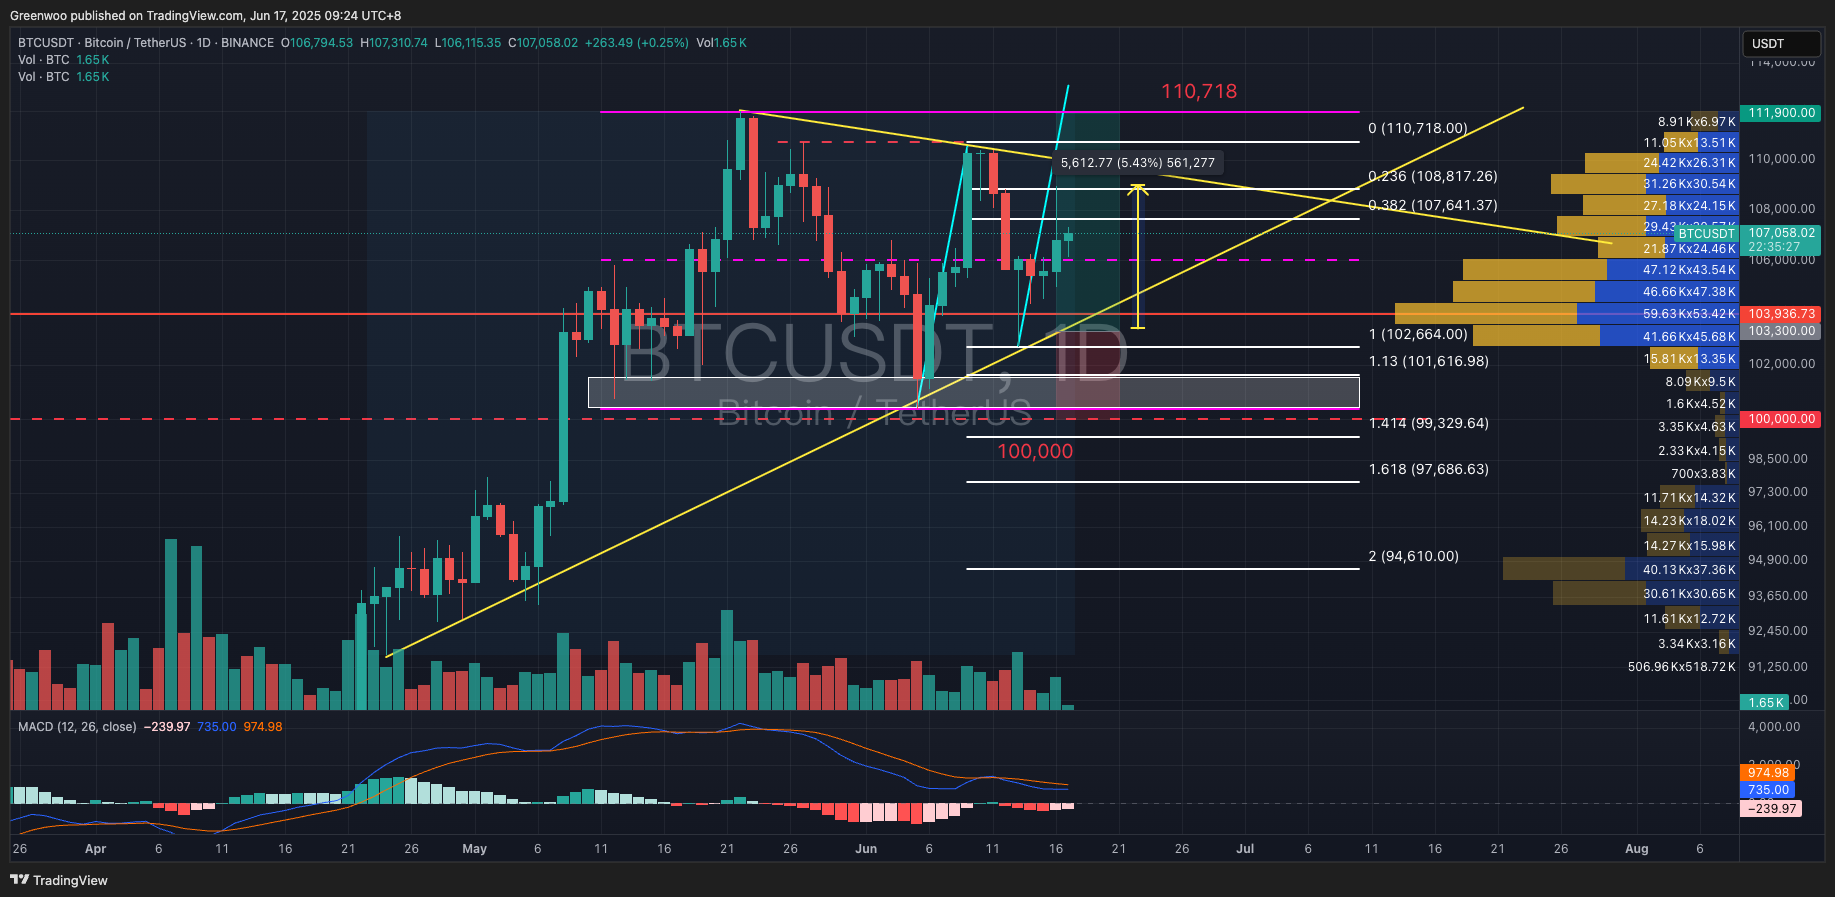
Yesterday, BTC surged to $108,952 before pulling back. If you went long based on the June 13 analysis, your unrealized profit should be around 5.5%. The long upper shadow on the candlestick indicates strong resistance, especially as this level aligns with the inverse Fibonacci 0.236, likely triggering many short orders.
The price-volume relationship shows a price increase with declining volume, a typical short-squeeze phenomenon. If holding a long position, consider closing to lock in profits or hedging to avoid losses.
Continue monitoring the price reactions at the upper and lower trendlines of the triangle pattern (yellow lines), as well as the white support zone and the $100,000 level. Significant breakouts or breakdowns at these key levels would be ideal for entering trades.
ETH

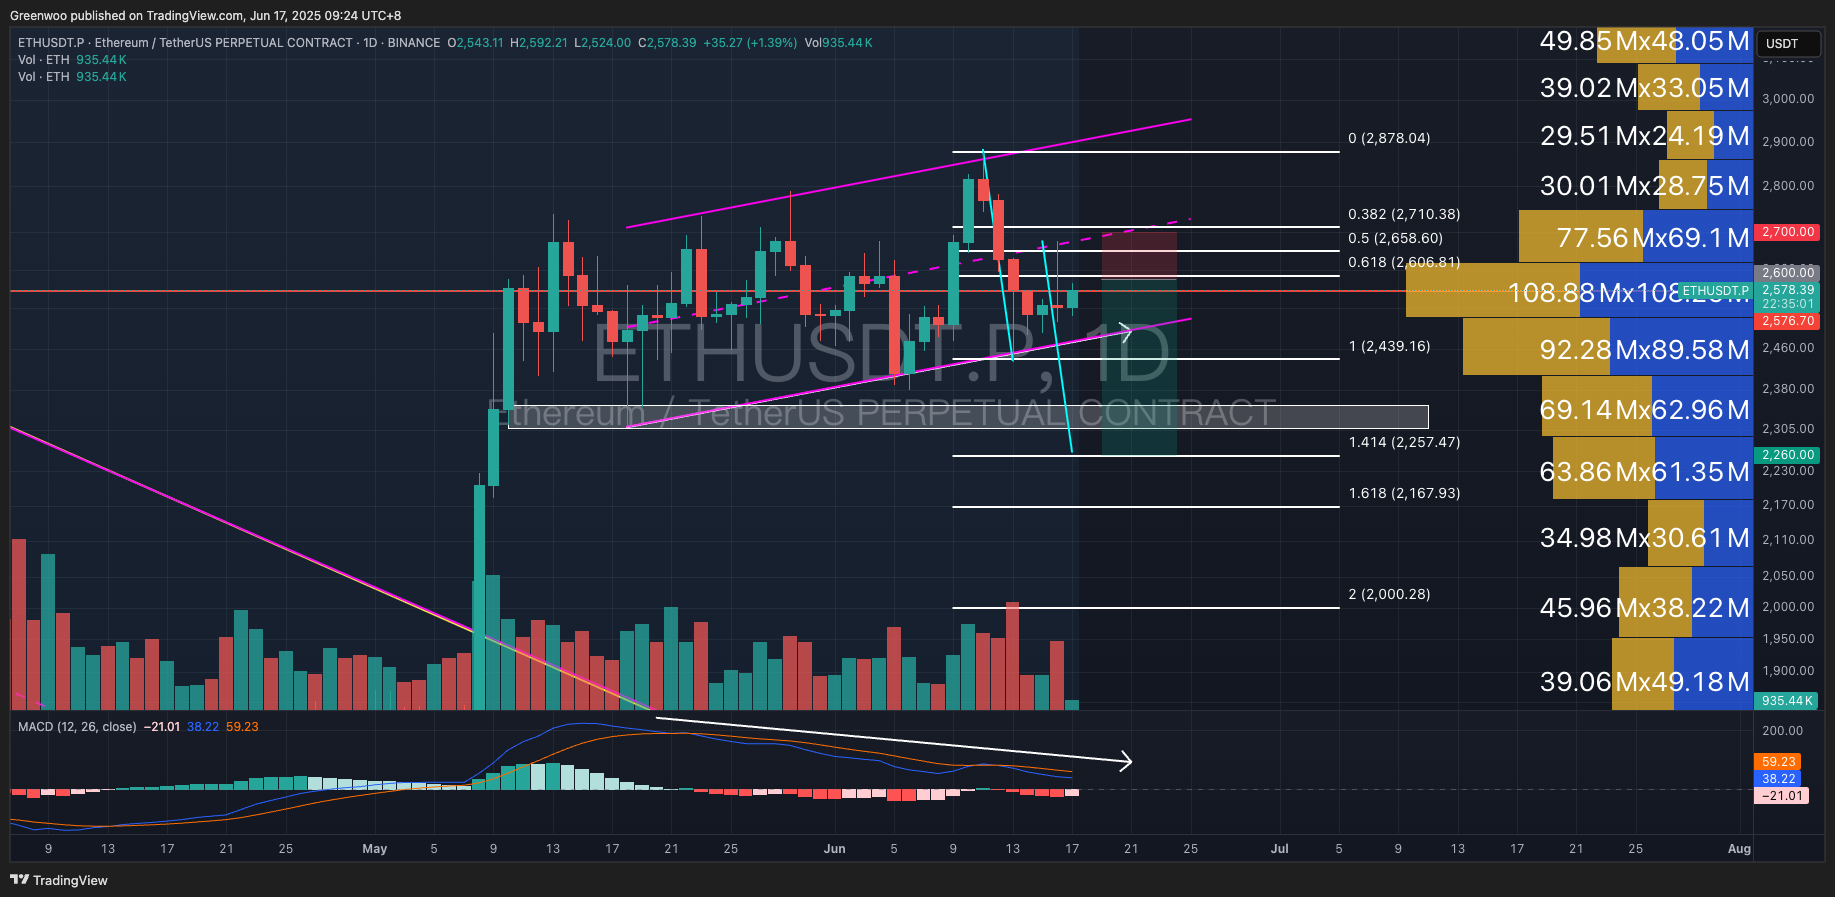
ETH also rose with the market yesterday. Although trading volume slightly increased, it faced strong resistance at the midpoint of the flag pattern, resulting in a pullback. The closing price even dropped by 0.13%, indicating robust resistance at the flag's midpoint and a likely pattern reversal. The pullback aligns with Fibonacci 0.5. Based on pattern analysis (aqua line), the target price is around $2,260, roughly at Fibonacci 1.414.
This rally is likely a short-squeeze, liquidating short positions before a potential decline. As of writing, ETH is at $2,580. Investors can consider entering at market price or establishing short positions around $2,600–$2,610, which aligns with Fibonacci 0.618.
Take-profit levels align with the pattern’s measured move at $2,260. Set stop-loss based on personal risk tolerance, above the flag’s midpoint or previous high.
Reference Levels:
Direction: Short
Entry: $2,580 (market) - $2,610
Take Profit: $2,440 / $2,320 / $2,260
Stop Loss: $2,681 - $2,700
LTC

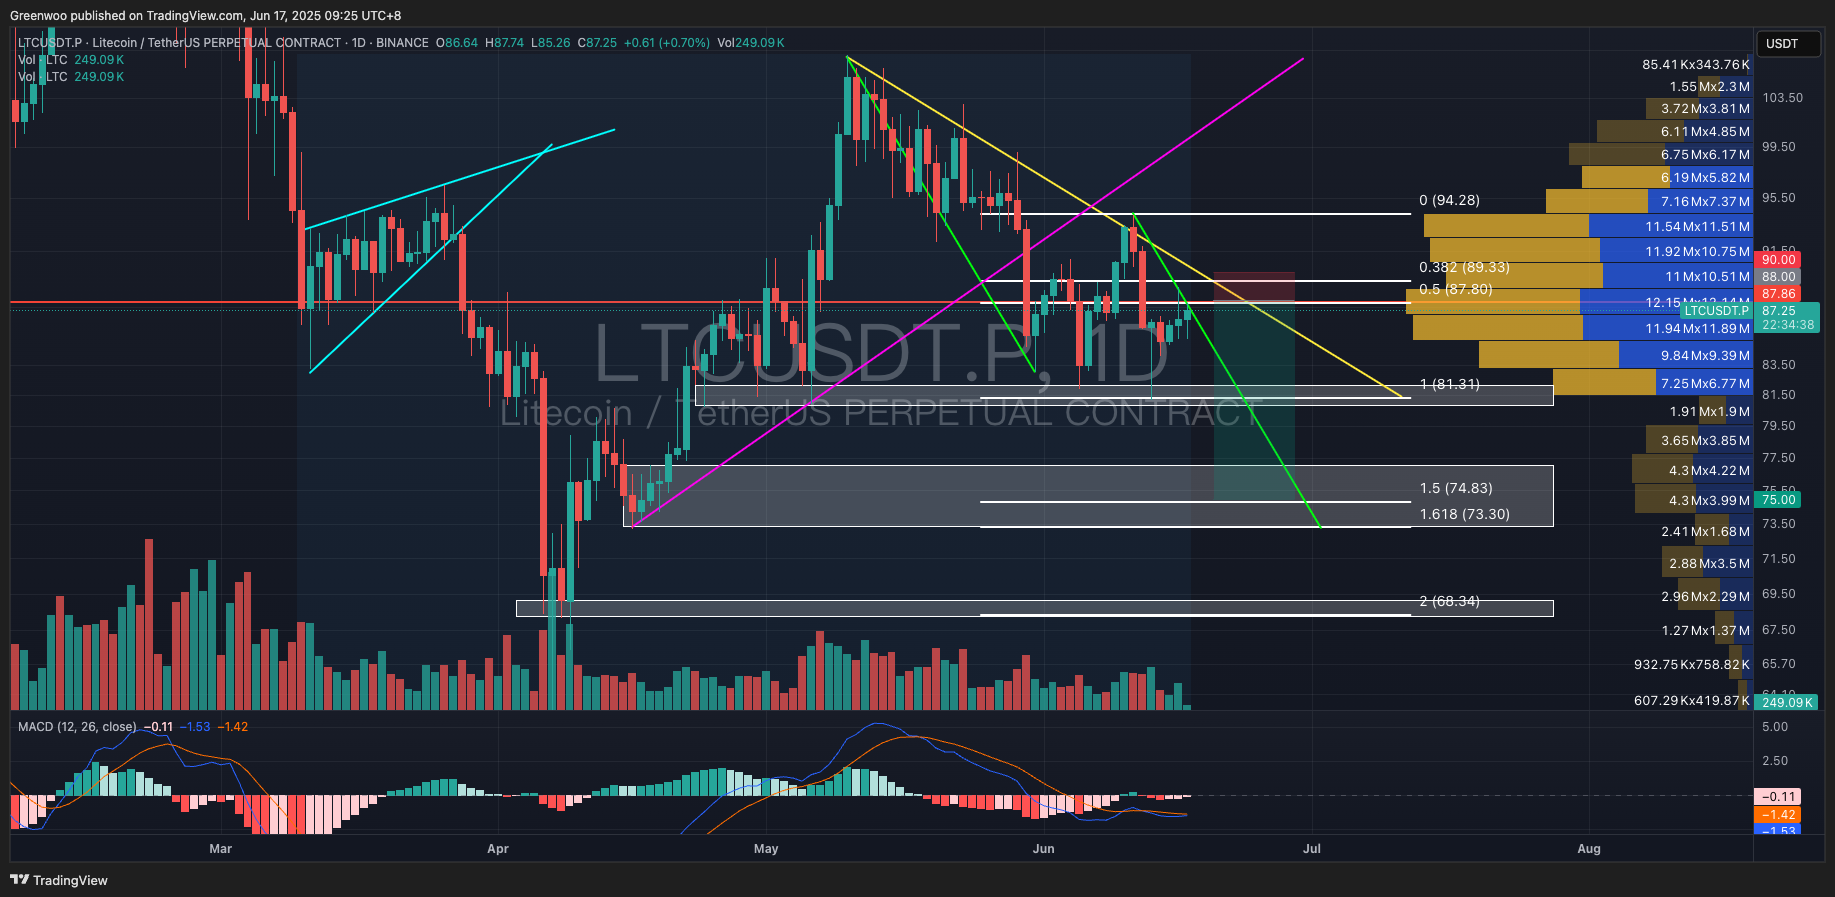
LTC rose with the market yesterday but faced resistance at $88.9 and pulled back. The current price pattern remains within a descending trendline (yellow line) with no reversal signals, suggesting the downtrend will likely continue.
As of writing, LTC is at $87. Investors can enter at market price or set short orders around $88, which aligns with Fibonacci 0.5. Take-profit targets, based on pattern analysis (green line), are around $73.3–$75, corresponding to Fibonacci 1.618–1.5, also a previous order block support zone. Set stop-loss based on personal risk tolerance, up to $90, above the descending trendline or its high.
Reference Levels:
Direction: Short
Entry: $87 - $88
Take Profit: $82 / $75 / $73.3
Stop Loss: $90
Disclaimer: None of the information contained here constitutes an offer (or solicitation of an offer) to buy or sell any currency, product or financial instrument, to make any investment, or to participate in any particular trading strategy.