[Bitop Review] Crypto Analysis: EGLD, RENDER, SEI
2025年05月28日发布
EGLD

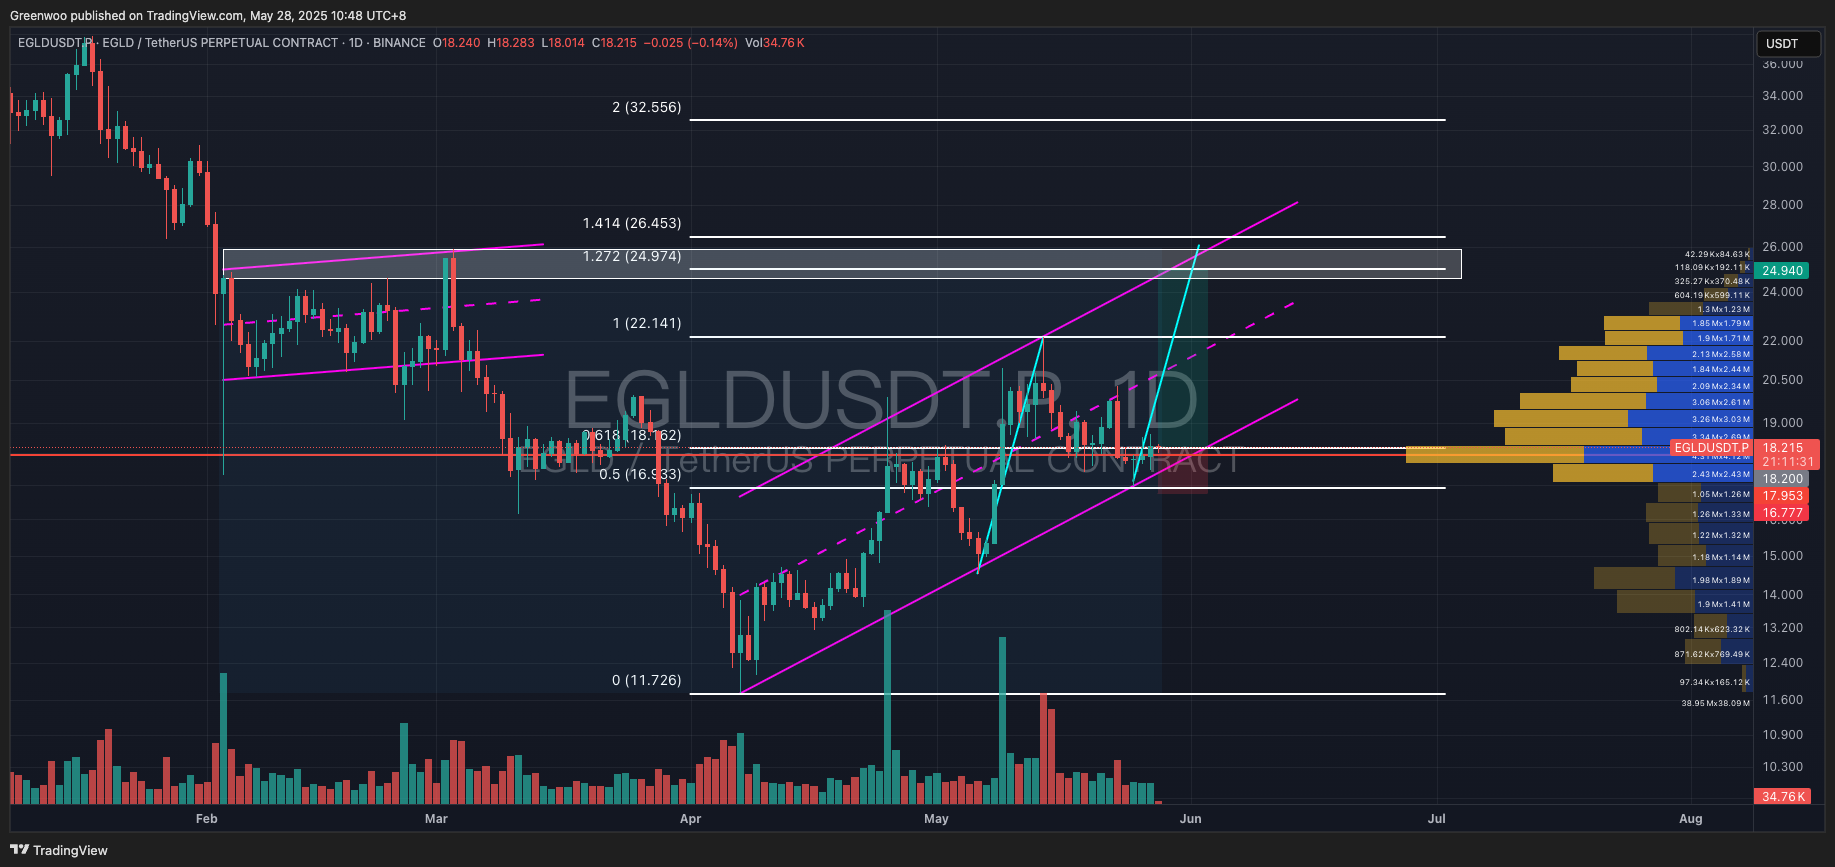
EGLD has recently formed an ascending channel (large purple parallel channel), currently trading at $18.2. This price level coincides with the Fibonacci 0.618, a high-volume trading zone, and the lower channel boundary, providing triple support.
Investors can enter a long position at market price, targeting a take-profit around $25–$26. This zone aligns with Fibonacci 1.272–1.414 and the upper resistance of a smaller flag pattern (small purple parallel channel). The stop-loss can be set below the high-volume zone at $17.1.
Reference Levels:
Direction: Long
Entry: $18.2
Take-Profit: $24.94
Stop-Loss: $16.8
RENDER

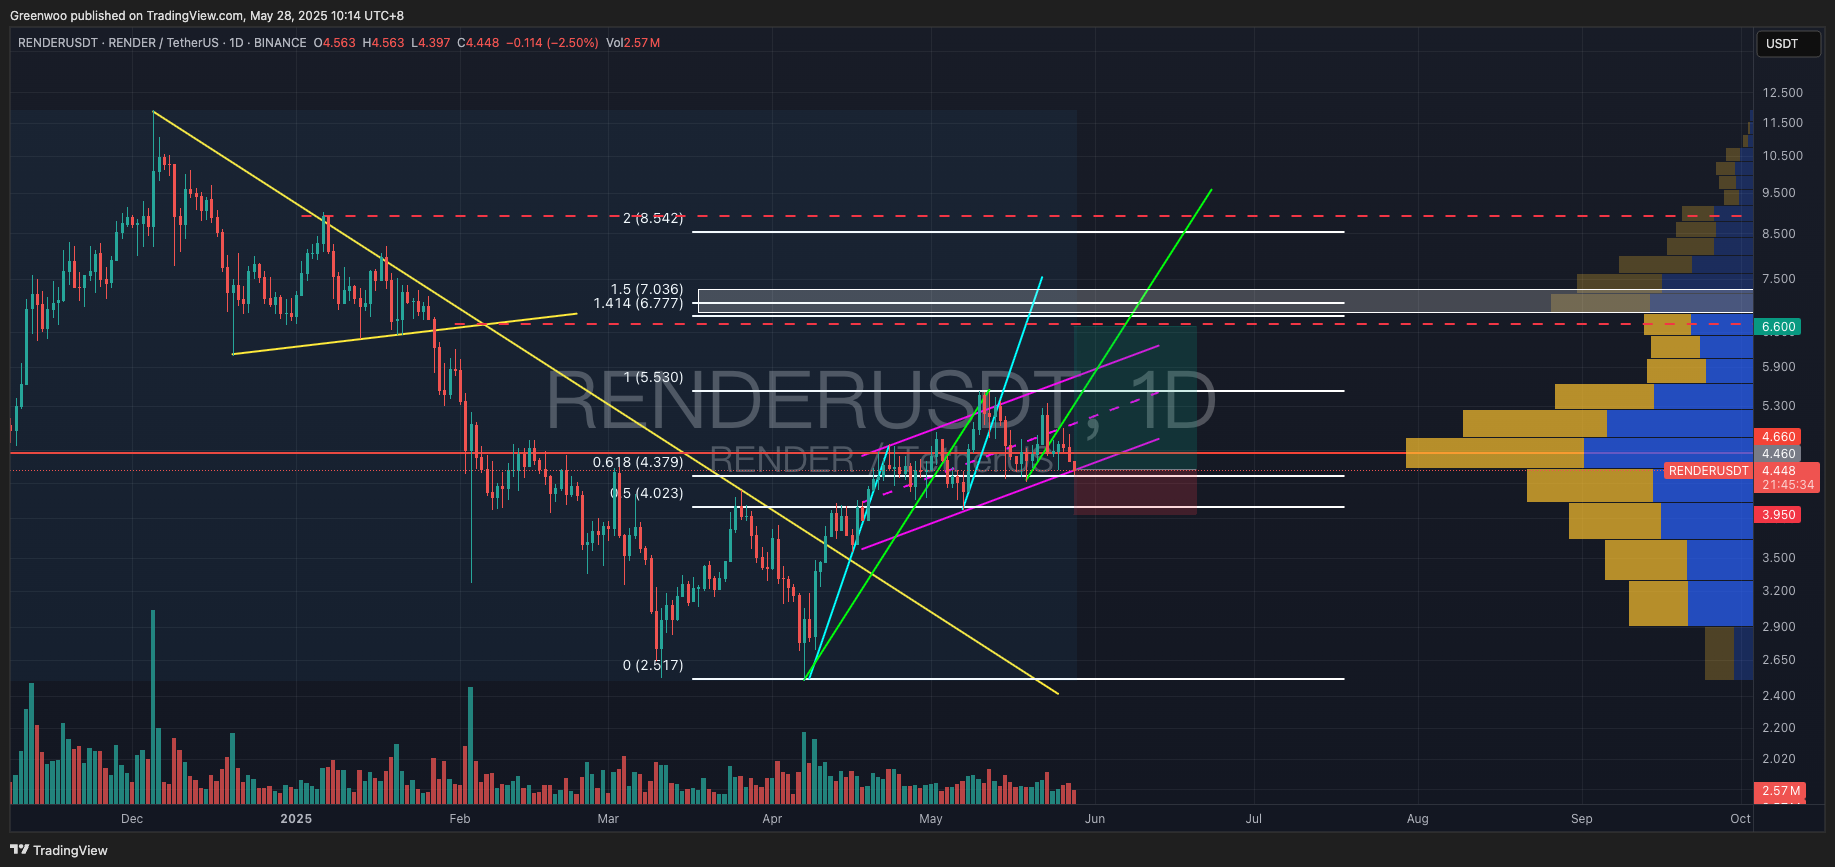
RENDER recently broke above a descending trendline (long yellow line) and has been gradually rising, forming a flag pattern (purple parallel channel). It is currently trading at around $4.45, near the lower boundary of the flag. If the price finds support here and rebounds, the next resistance is approximately $6.6–$6.9, which aligns with the upper triangle endpoint and a high-volume trading zone (white rectangle).
Investors can enter a long position here or wait to observe price action after the daily close. A break below the flag pattern today is possible, in which case one could wait for a retest to enter a short position. For those entering a long position, take-profit targets can be set at the previous high of $5.5, the resistance zone of $6.6–$6.7, and around $8.5–$9. The stop-loss can be placed below the previous low at $4.
Reference Levels
Direction: Long
Entry: $4.4–$4.46
Take-Profit: $5.5 / $6.777 / $8.5–$9
Stop-Loss: $3.95
SEI

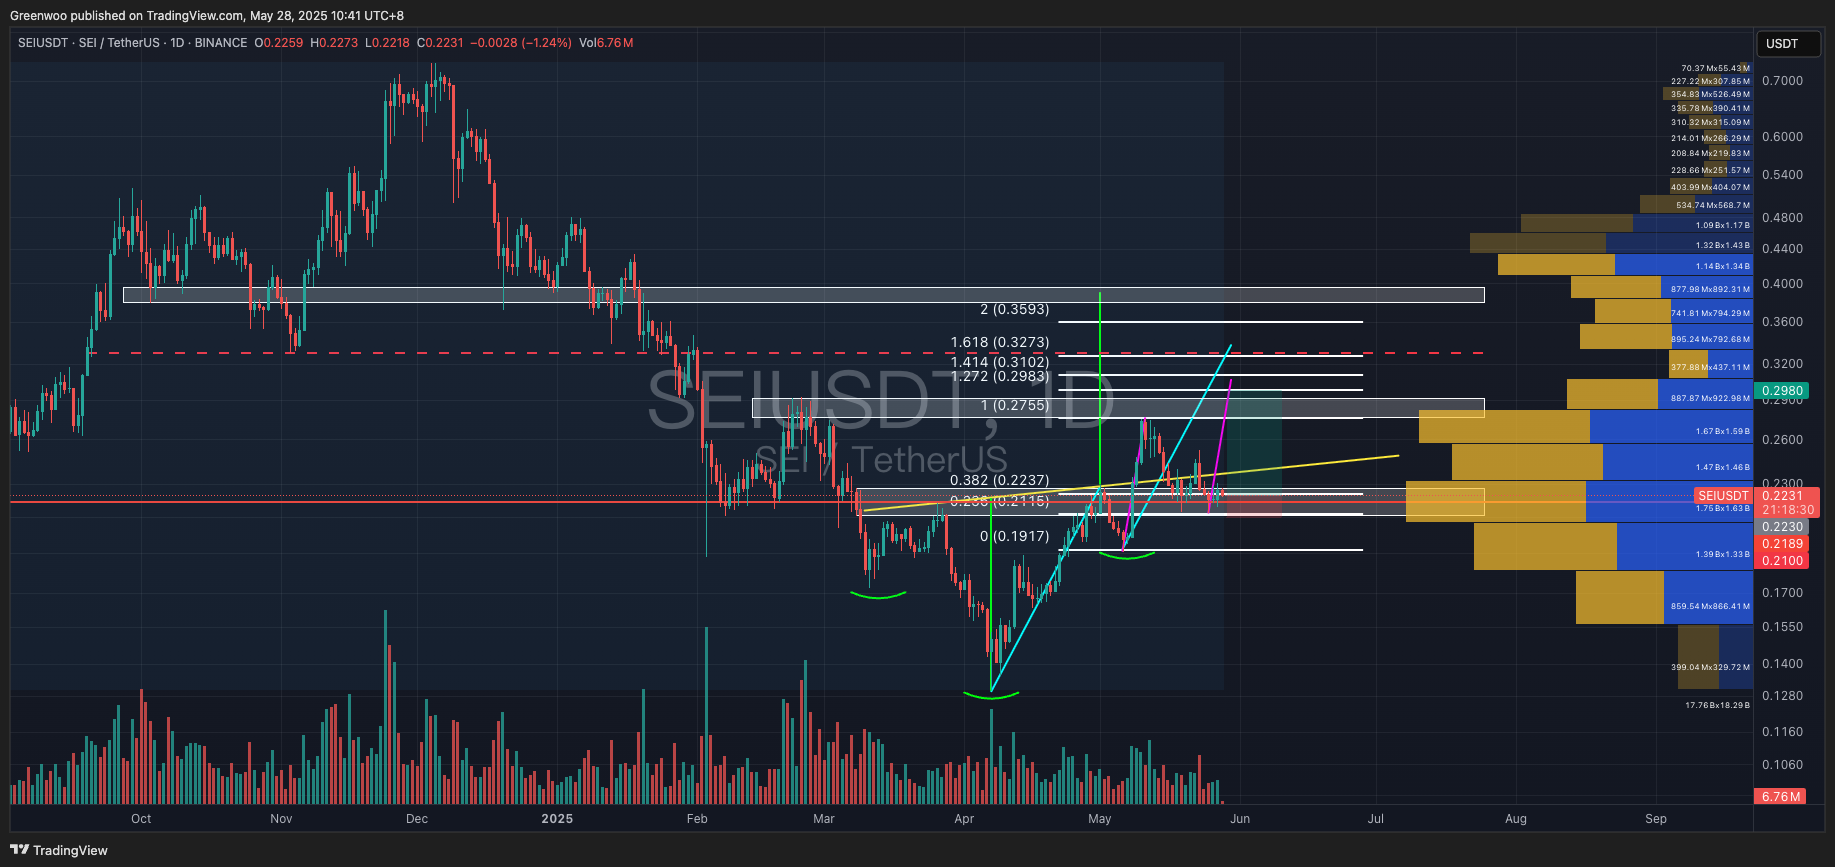
SEI recently broke out of a head-and-shoulders bottom pattern, with three green curves representing the two shoulders and the head. After hitting resistance at $0.275, it pulled back and is currently trading at $0.223.
The current price is near the neckline support zone (yellow line) and a high-volume trading area (white rectangle). Investors can enter a long position here, with take-profit targets at the previous high of $0.3 and the pattern target of around $0.327, which coincides with Fibonacci 1.618 and an upper resistance line. The stop-loss can be set at the previous low of $0.19, or more conservatively at the lower end of the support zone at $0.21.
Reference Levels
Direction: Long
Entry: $0.223
Take-Profit: $0.298 / $0.325
Stop-Loss: $0.21
Disclaimer: None of the information contained here constitutes an offer (or solicitation of an offer) to buy or sell any currency, product or financial instrument, to make any investment, or to participate in any particular trading strategy.