[Bitop Review] Technical Analysis: BTC, ETH, SOL
2025年04月22日发布

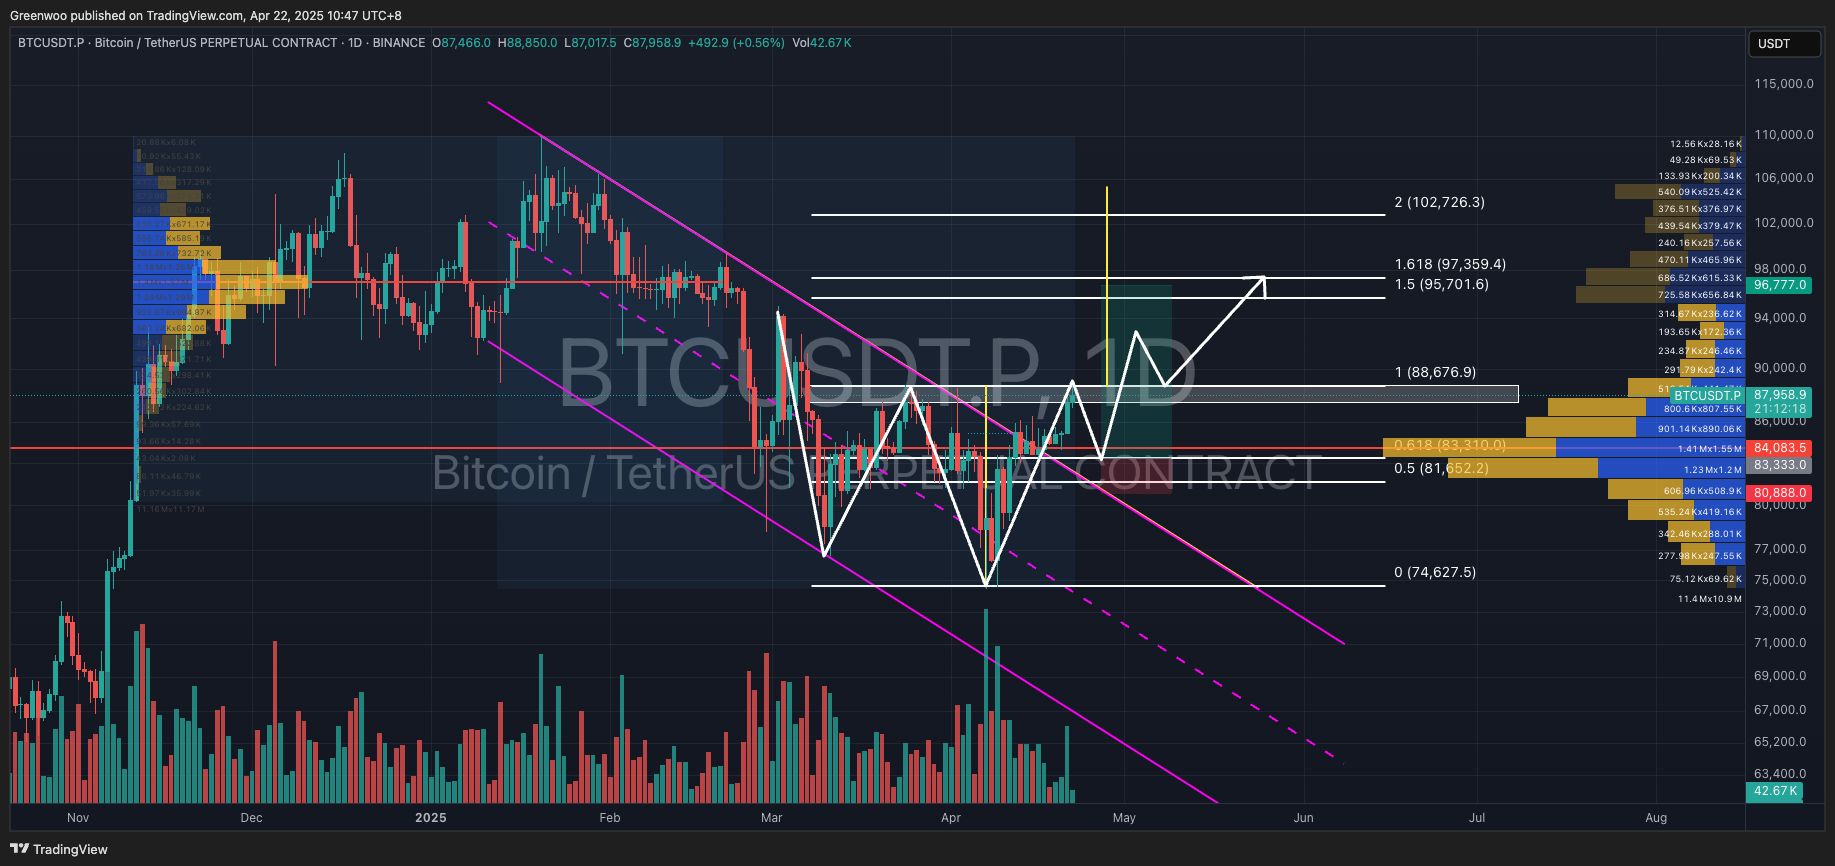
Yesterday (21st), BTC broke through the descending channel, and trading volume also increased. At the time of writing, it is temporarily trading at $88,100. This level coincides with the previous high and the neckline of a potential inverse head and shoulders pattern, forming a resistance zone (white block in the chart).
After a trend breakout, a pullback to test the support zone is common and represents a more conservative entry strategy. Based on the current price action, BTC is likely forming an inverse head and shoulders pattern (white path in the chart). The pullback could potentially reach around $83,310 (Fibonacci 0.618 level). This level also aligns with a high-volume trading area.
If the price successfully rebounds after the pullback and holds above the support, the target price is set around $97,350. This level also coincides with an upper high-volume trading area and the Fibonacci 1.618 level.
Here are some reference points:
Direction: Long
Entry: $83,333 (Fibonacci 0.5 - 0.618)
Take Profit: $96,777 (Fibonacci 1.618 + High-Volume Trading Area)
Stop Loss: $80,888
ETH

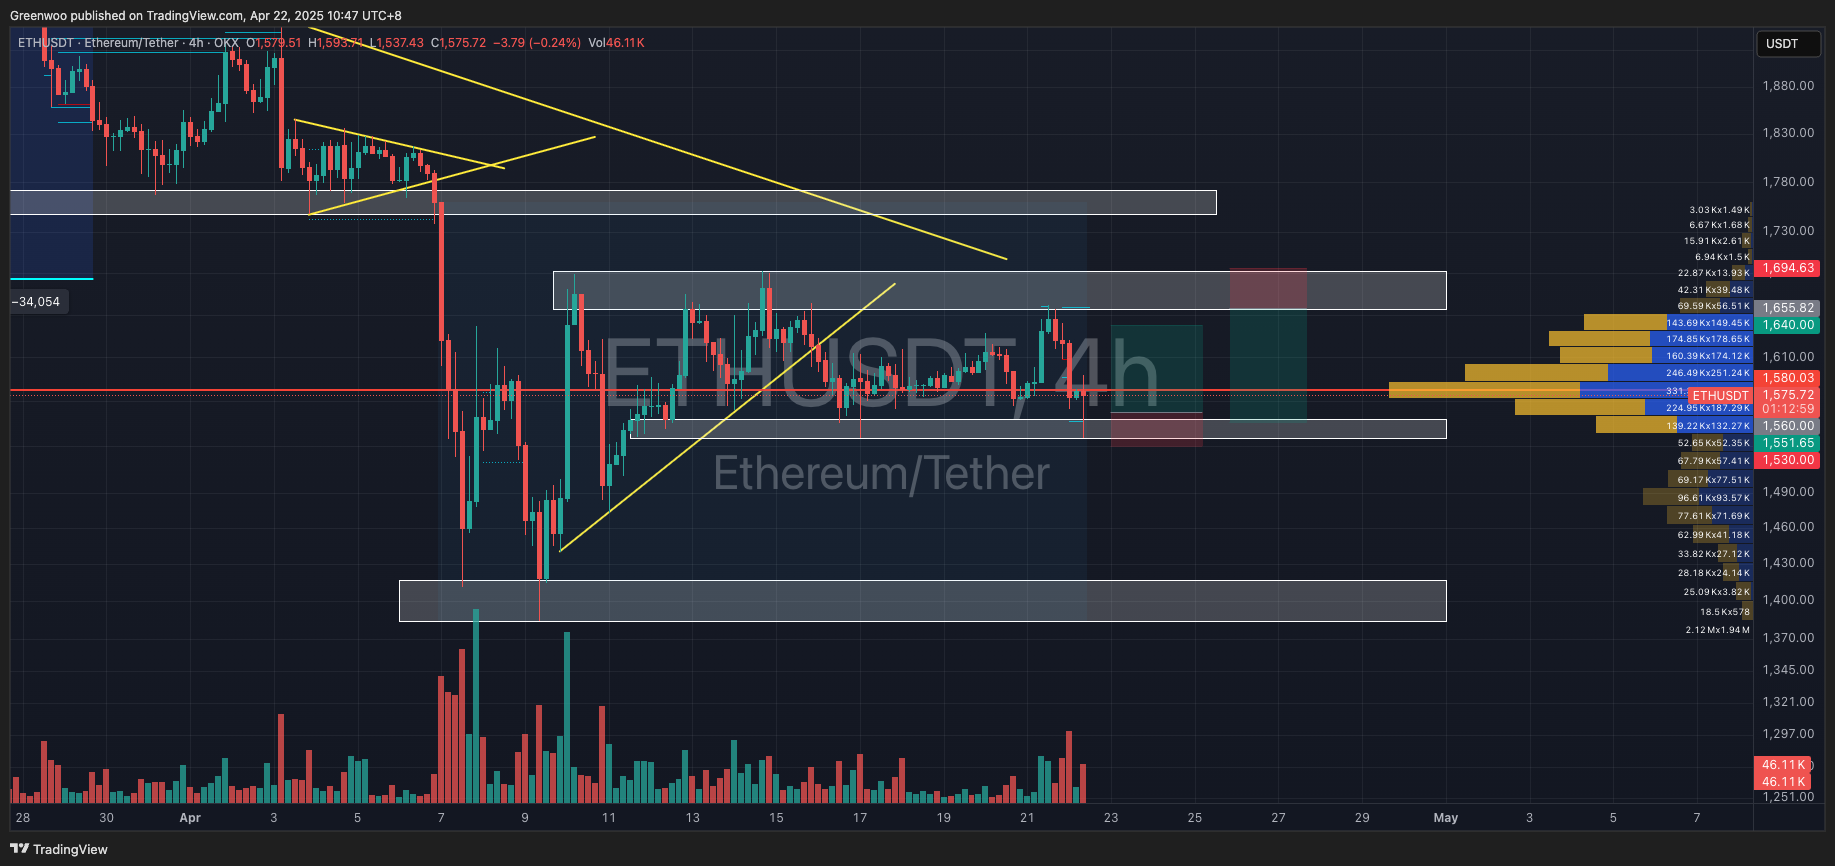
After breaking below the trend line last week, ETH found support and rebounded near $1,537. Following five days of consolidation, the price has touched the $1,537 level again and found support once more. On the 4-hour chart, the price action has formed a rectangular pattern.
We can assume that the price will oscillate within this rectangular range, between $1,530 and $1,690. This presents short-term trading opportunities. Here are some reference points:

SOL

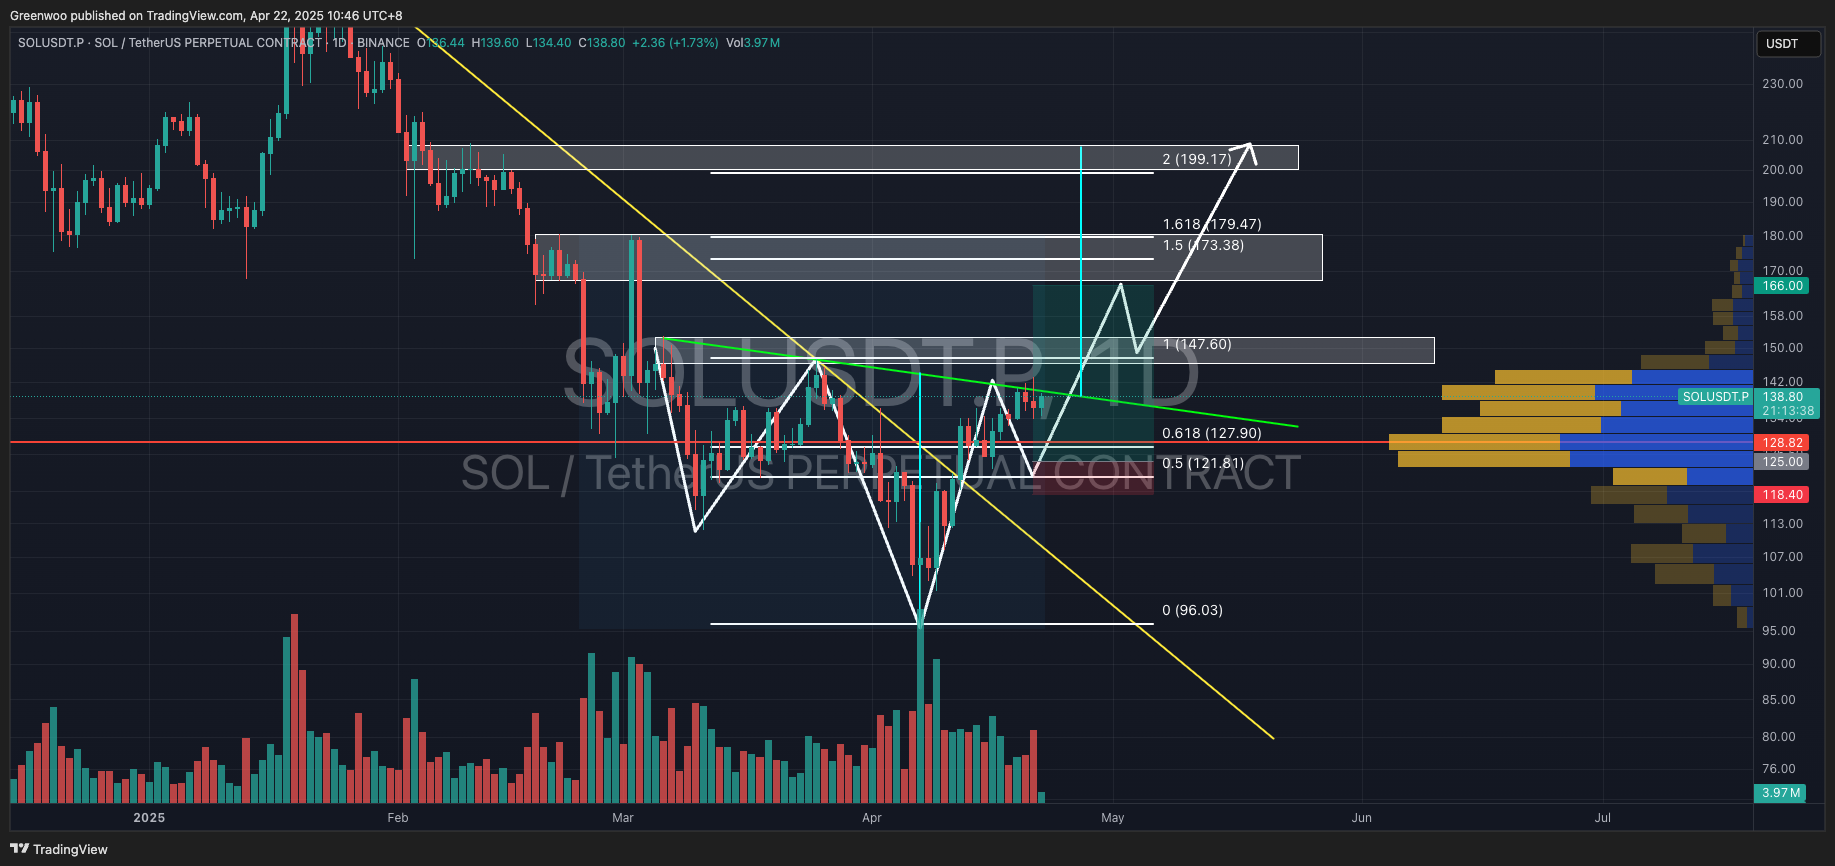
SOL's price action is similar to BTC, with both forming a potential inverse head and shoulders pattern (white path in the chart). Last week, we predicted that the price might touch the neckline and then pull back. Currently, the price has been hovering near the neckline for two days but has yet to break through upwards.
If our prediction holds, the price should fall back to test the lower support before rebounding. This would also be a good entry opportunity. Based on the current trend, investors can consider establishing long positions around the $125 - $130 range. The first take-profit target is around $166, with a potential upside to $200. The stop loss should be set around $118 - $120.
Direction: Long
Entry: $125 - $130
Take Profit: $166 - $199
Stop Loss: $118.4
Disclaimer: None of the information contained here constitutes an offer (or solicitation of an offer) to buy or sell any currency, product or financial instrument, to make any investment, or to participate in any particular trading strategy.